Figure 1
Evaluation of the LumiraDx SARS-CoV-2 antigen assay for large-scale population testing in Senegal
Moustapha Mbow*, Ibrahima Diallo, Mamadou Diouf, Marouba Cissé#, Moctar Gningue#, Aminata Mboup, Nafissatou Leye, Gora Lo, Yacine Amet Dia, Abdou Padane, Djibril Wade, Josephine Khady Badiane, Oumar Diop, Aminata Dia, Ambroise Ahouidi, Doudou George Massar Niang, Babacar Mbengue, Maguette Dème Sylla Niang, Papa Alassane Diaw, Tandakha Ndiaye Dieye, Badara Cisé, El Hadj Mamadou Mbaye, Alioune Dieye and Souleymane Mboup
Published: 05 January, 2022 | Volume 6 - Issue 1 | Pages: 001-006
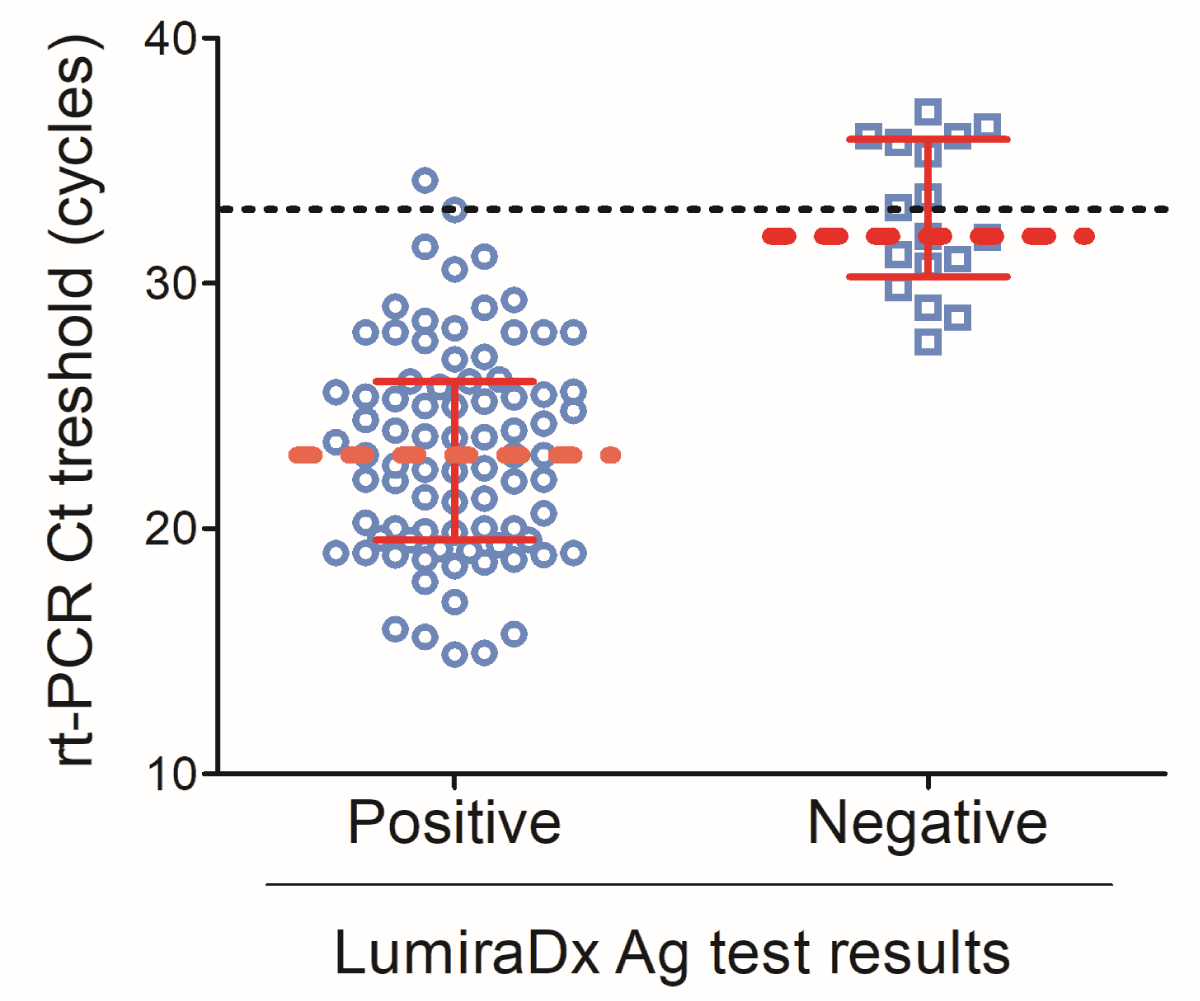
Figure 1:
LumiraDx test results according to the RT-PCR threshold cycle. Scatter plot of the RT-PCR threshold cycle and LumiraDx positive and negative results. Data are shown as median discontinuous line displays the threshold of 33 cycles. Graph has been designed using GraphPad Prism 5.0.
Read Full Article HTML DOI: 10.29328/journal.ijcv.1001041 Cite this Article Read Full Article PDF
More Images
Similar Articles
-
Hypothesis about pathogenic action of Sars-COV-2Del Prete Salvatore*,Marasco Daniela,Sabetta Rosalaura. Hypothesis about pathogenic action of Sars-COV-2. . 2020 doi: 10.29328/journal.ijcv.1001009; 4: 021-022
-
Exploring pathophysiology of COVID-19 infection: Faux espoir and dormant therapeutic optionsVinod Nikhra*. Exploring pathophysiology of COVID-19 infection: Faux espoir and dormant therapeutic options. . 2020 doi: 10.29328/journal.ijcv.1001013; 4: 034-040
-
Identifying patterns in COVID-19: Morbidity, recovery and the aftermathVinod Nikhra*. Identifying patterns in COVID-19: Morbidity, recovery and the aftermath. . 2020 doi: 10.29328/journal.ijcv.1001016; 4: 056-064
-
Can house flies mechanically carry and/or transport sars-cov-2?Alfredo Montes*,Wilfrido Coronell,Rosa Baldiris. Can house flies mechanically carry and/or transport sars-cov-2?. . 2020 doi: 10.29328/journal.ijcv.1001019; 4: 076-078
-
Inhaled statins to combat COVID-19 – prophylactic and treatment approachArchana P Iyer*,Maryam A Al-Ghamdi. Inhaled statins to combat COVID-19 – prophylactic and treatment approach. . 2020 doi: 10.29328/journal.ijcv.1001020; 4: 079-080
-
A Comprehensive review on genomic diversity and epidemiology of COVID-19Zeshan Haider Raza*,Muhammad Ahmed Ihsan,Sahrish Khan,Haroon Zafar,Tayyaba Rehman. A Comprehensive review on genomic diversity and epidemiology of COVID-19. . 2020 doi: 10.29328/journal.ijcv.1001021; 4: 081-095
-
COVID-19 pandemic, recurrent outbreaks and prospects for assimilation of hCoV-19 into the human genomeVinod Nikhra*. COVID-19 pandemic, recurrent outbreaks and prospects for assimilation of hCoV-19 into the human genome. . 2020 doi: 10.29328/journal.ijcv.1001025; 4: 111-115
-
Stages in COVID-19 vaccine development: The Nemesis, the Hubris and the ElpisVinod Nikhra*. Stages in COVID-19 vaccine development: The Nemesis, the Hubris and the Elpis. . 2020 doi: 10.29328/journal.ijcv.1001028; 4: 126-135
-
Exploring COVID-19: Relating the spike protein to infectivity, pathogenicity and ImmunogenicityVinod Nikhra*. Exploring COVID-19: Relating the spike protein to infectivity, pathogenicity and Immunogenicity. . 2021 doi: 10.29328/journal.ijcv.1001029; 5: 001-010
-
Living with ‘Long COVID-19’: The long-term complications and sequelaeVinod Nikhra*. Living with ‘Long COVID-19’: The long-term complications and sequelae. . 2021 doi: 10.29328/journal.ijcv.1001030; 5: 011-021
Recently Viewed
-
Sex after Neurosurgery–Limitations, Recommendations, and the Impact on Patient’s Well-beingMor Levi Rivka*, Csaba L Dégi. Sex after Neurosurgery–Limitations, Recommendations, and the Impact on Patient’s Well-being. J Neurosci Neurol Disord. 2024: doi: 10.29328/journal.jnnd.1001099; 8: 064-068
-
Physiotherapy Undergraduate Students’ Perception About Clinical Education; A Qualitative StudyPravakar Timalsina*,Bimika Khadgi. Physiotherapy Undergraduate Students’ Perception About Clinical Education; A Qualitative Study. J Nov Physiother Rehabil. 2024: doi: 10.29328/journal.jnpr.1001063; 8: 043-052
-
Clinical Significance of Anterograde Angiography for Preoperative Evaluation in Patients with Varicose VeinsYi Liu,Dong Liu#,Junchen Li#,Tianqing Yao,Yincheng Ran,Ke Tian,Haonan Zhou,Lei Zhou,Zhumin Cao*,Kai Deng*. Clinical Significance of Anterograde Angiography for Preoperative Evaluation in Patients with Varicose Veins. J Radiol Oncol. 2025: doi: 10.29328/journal.jro.1001073; 9: 001-006
-
Regional Anesthesia Challenges in a Pregnant Patient with VACTERL Association: A Case ReportUzma Khanam*,Abid,Bhagyashri V Kumbar. Regional Anesthesia Challenges in a Pregnant Patient with VACTERL Association: A Case Report. Int J Clin Anesth Res. 2025: doi: 10.29328/journal.ijcar.1001027; 9: 010-012
-
Cystoid Macular Oedema Secondary to Bimatoprost in a Patient with Primary Open Angle GlaucomaKonstantinos Kyratzoglou*,Katie Morton. Cystoid Macular Oedema Secondary to Bimatoprost in a Patient with Primary Open Angle Glaucoma. Int J Clin Exp Ophthalmol. 2025: doi: 10.29328/journal.ijceo.1001059; 9: 001-003
Most Viewed
-
Evaluation of Biostimulants Based on Recovered Protein Hydrolysates from Animal By-products as Plant Growth EnhancersH Pérez-Aguilar*, M Lacruz-Asaro, F Arán-Ais. Evaluation of Biostimulants Based on Recovered Protein Hydrolysates from Animal By-products as Plant Growth Enhancers. J Plant Sci Phytopathol. 2023 doi: 10.29328/journal.jpsp.1001104; 7: 042-047
-
Sinonasal Myxoma Extending into the Orbit in a 4-Year Old: A Case PresentationJulian A Purrinos*, Ramzi Younis. Sinonasal Myxoma Extending into the Orbit in a 4-Year Old: A Case Presentation. Arch Case Rep. 2024 doi: 10.29328/journal.acr.1001099; 8: 075-077
-
Feasibility study of magnetic sensing for detecting single-neuron action potentialsDenis Tonini,Kai Wu,Renata Saha,Jian-Ping Wang*. Feasibility study of magnetic sensing for detecting single-neuron action potentials. Ann Biomed Sci Eng. 2022 doi: 10.29328/journal.abse.1001018; 6: 019-029
-
Pediatric Dysgerminoma: Unveiling a Rare Ovarian TumorFaten Limaiem*, Khalil Saffar, Ahmed Halouani. Pediatric Dysgerminoma: Unveiling a Rare Ovarian Tumor. Arch Case Rep. 2024 doi: 10.29328/journal.acr.1001087; 8: 010-013
-
Physical activity can change the physiological and psychological circumstances during COVID-19 pandemic: A narrative reviewKhashayar Maroufi*. Physical activity can change the physiological and psychological circumstances during COVID-19 pandemic: A narrative review. J Sports Med Ther. 2021 doi: 10.29328/journal.jsmt.1001051; 6: 001-007

HSPI: We're glad you're here. Please click "create a new Query" if you are a new visitor to our website and need further information from us.
If you are already a member of our network and need to keep track of any developments regarding a question you have already submitted, click "take me to my Query."


